
The equity curve and the ROI chart
A strategy provider’s record starts with a line. This page reads the two lines that cTrader Copy describes in its help page, and the small curve on the public cards, with the numbers of 20 named cards read on 6 November 2026. A copied trade is a leveraged contract on a price; the follower carries the loss on their own account.
Two charts that look alike
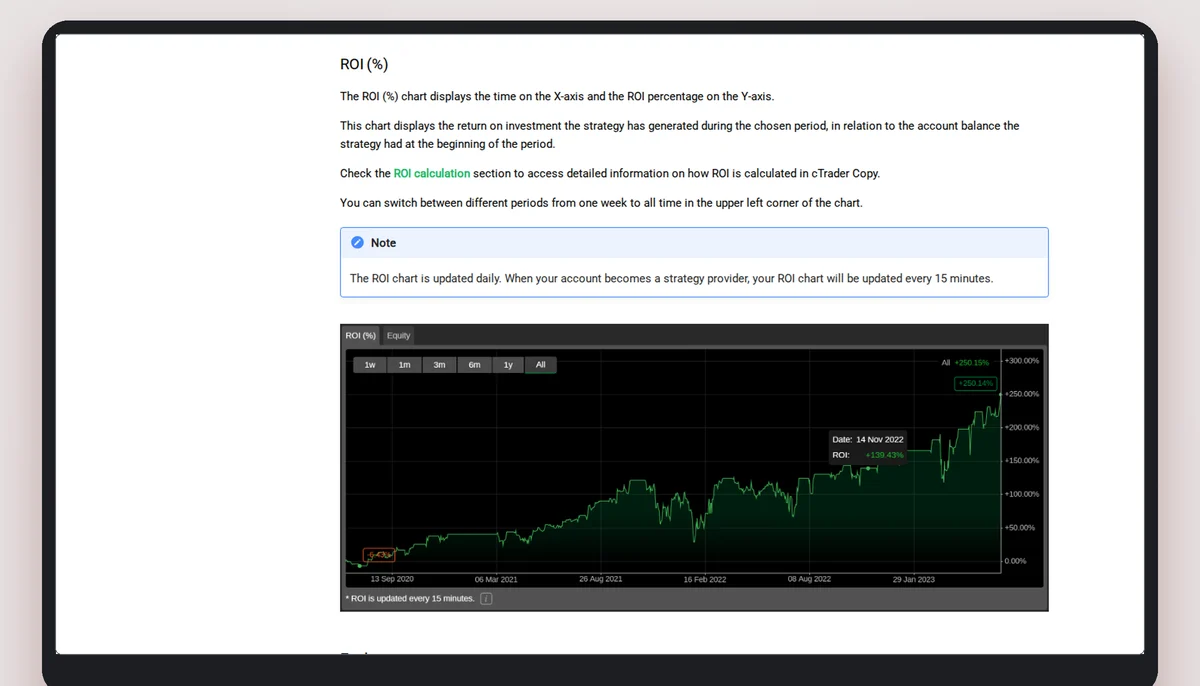
The help page for the strategy page describes two charts. The equity chart “plots time on the X-axis and the cash value on the Y-axis. It indicates the changes in the account equity concerning the account balance over the chosen period.” The ROI (%) chart “displays the return on investment the strategy has generated during the chosen period, in relation to the account balance the strategy had at the beginning of the period.”
They answer different questions. One is a cash value, so it moves with the size of the account and with deposits and withdrawals. The other is a percentage of a starting balance, so it moves with performance relative to that balance. A reader who is shown one of them has not been shown the other. The ROI chart can be switched “from one week to all time”, and the help page adds that it “is updated daily”; the period you look at is a choice, and a short period can look unlike a long one.
What equity means here
The help page defines equity as “the account balance minus unrealised net loss, then plus unrealised net profit”. Balance changes when a trade is closed; equity also changes while a trade is open. A line drawn from equity therefore includes the swings of positions that have not been closed yet, and a line drawn from balance does not. The help page calls the equity chart “particularly important to understand the strategy risk factor and what drawdown can be expected”. That is the platform’s description of the chart; this site reports it and does not add to it.
The small curve on the public card
The public cards on ctrader.com/copy/symbols print a small curve of 29 daily points, from 8 October 2026 to 5 November 2026. The card does not say what the line measures or in what unit, and it does not say whether it is the equity chart, the ROI chart or something else. This site therefore calls the values “chart units” and makes no claim about what they are. One thing can be checked: the line is not re-based to zero at the start of the window. Seven of the 20 curves start at exactly zero; the other thirteen start above or below it. So the last point is not “the gain over the window” for every card, and this site never presents it as that.
The 29 points of each curve, summarised, read on 6 November 2026
Same 20 cards, same order as on the home page. Each row reads the 29 daily points between 8 October 2026 and 5 November 2026: the first point, the highest, the lowest, the last, the largest drop from an earlier point, and whether the last point is the window’s highest. Nothing here is a return for a reader.
| Card | First point | Highest | Lowest | Last point | Largest fall | Last = highest? |
|---|---|---|---|---|---|---|
| LogicFX · Empire Trades | 0 | 4.1 | 0 | 4.1 | 0 | Yes |
| ctid4925965 · The Deep Secret | 0 | 0.05 | −1.97 | −0.58 | −2.02 | No |
| ToTheMoonRobot · PainGain cTrader | 0 | 3.91 | −3.64 | 3.91 | −3.88 | Yes |
| ctid4925965 · Diesel | 0 | 1.08 | −1.98 | 0.94 | −2.03 | No |
| husseinalmoders · CR7 | −0.04 | 2.74 | −13.66 | −13.66 | −16.4 | No |
| ctid4925965 · SMART TRADER OM | 0 | 1.32 | −2.36 | 1.14 | −2.43 | No |
| ctid4925965 · Rostova | 0 | 1.3 | −2.35 | 1.12 | −2.41 | No |
| femaletrader131341 · iloveyou | 1.04 | 32.05 | 1.04 | 32.05 | −0.1 | Yes |
| NeuroPhi · BlackSignal | −0.33 | 11.39 | −0.33 | 11.39 | 0 | Yes |
| RacerX5 · WriggleX5 | 0.52 | 42.89 | −14.99 | 42.89 | −36.79 | Yes |
| M.fund · ProMax | 0.72 | 37.41 | −6.47 | 37.41 | −22.15 | Yes |
| Aliyainvestments · ONE 9 | 0.01 | 0.01 | −6.74 | −4.3 | −6.75 | No |
| xauusdorbit · GOLD ORBIT | 1.11 | 20 | 1.11 | 20 | 0 | Yes |
| xauusdmars · GOLD MARS | 0.98 | 14.95 | 0.98 | 14.95 | −0.06 | Yes |
| antoninsus21 · Smartegy Trading | 0 | 0.39 | −0.75 | −0.75 | −1.14 | No |
| Aliyainvestments · ONE | 0.02 | 0.02 | −11 | −3.66 | −11.02 | No |
| EUFund · Less risk it more bisquit | 1.95 | 27.06 | 1.95 | 27.06 | 0 | Yes |
| Ethereum · Camel | 4.03 | 112.71 | 4.03 | 112.71 | −3.11 | Yes |
| femaIetrader131341 · iloveyou so much | 3.62 | 78.71 | 3.62 | 78.71 | 0 | Yes |
| Li5056 · Method | 7.29 | 245.28 | 7.29 | 245.28 | 0 | Yes |
Shapes in the table, described and not graded
Twelve of the 20 curves end at their own highest point of the window, and five end below zero. Seven start with a stretch of identical zero points (the number of days is in brackets): Empire Trades (6); The Deep Secret (4); PainGain cTrader (1); Diesel (4); SMART TRADER OM (4); Rostova (4); Smartegy Trading (6). The card gives no reason for a flat stretch, and this site does not guess one. On two cards the 29 points take 5 different values or fewer (Empire Trades, Smartegy Trading): the line moved on few days, or stayed level for long stretches.
One row shows how far a short window and a printed return can part. husseinalmoders · CR7 has a last point of −13.66 and a largest fall of −16.4 in the window, while the return printed beside it in the card table on the home page is positive. The two numbers cover different stretches of time, and the card does not say how long the printed one is. Reading them together without that fact would be a mistake in either direction.
Smoothness is a question, not a verdict
A line that climbs in small even steps and a line that is flat for weeks and then jumps can end at the same height. They ask different questions of a reader. For the first: how large was each position relative to the account, and what happened on the days that are missing from the picture? For the second: what produced the jump, and could it be produced again? A card cannot answer either question. The list of trades and open positions can, and the help page places those in the application.
What the line cannot tell a follower
A follower’s own account is sized by the ratio of two equities, and the help page says the provider’s and the investor’s prices may differ. The follower’s line therefore starts on the day the follower starts and has its own shape. The help page keeps a separate view of this: strategies the investor is copying are “displayed per copying account”, and that page “only shows how the corresponding account has performed copying this strategy”. The provider’s line is not that page.
In brief
Read next
Questions about reading a record
Is the small curve on the card an equity curve?
The card does not say. It prints 29 daily points without a label for the unit, and this site does not name it.
Does the last point show what a follower would have gained in the window?
No. Thirteen of the 20 curves do not start at zero, and the window is 29 days of a record that is older than that on every card.
Which chart shows the fall a follower may live through?
The help page says the equity chart is particularly important to understand the strategy risk factor and what drawdown can be expected. The chart sits on the strategy page inside the application.
Why is the printed return not drawn into a curve here?
Because the card prints one number without a period. A curve needs dates, and the card does not give them for the return.
The broker this site links to
This site links to FxPro, which cTrader’s list marks as a copy-enabled broker. A copied trade is a leveraged contract on a price, not ownership of anything. Read the terms before you decide anything.