
A plain guide to reading a provider’s record.
A copy-trading record is a curve, a few statistics and an age. This guide reads what cTrader Copy prints on 20 public strategy cards and what its help pages define, one element at a time, with the date of the reading (6 November 2026) on every card. It ranks no provider, and a printed return is not an expectation.
What this site reads, and the one thing it does
Provider Check SA is a reading guide for one thing: the record that a copy-trading strategy provider shows. It reads two kinds of public page of cTrader Copy, the symbol pages that print strategy cards and the help pages that define the terms of a strategy page, and it writes down what they print. Every figure carries the day it was read. The latest reading was 6 November 2026.
The site is not a broker and does not hold money. It does not tell a reader which provider to copy, and it publishes no ranking of providers. Where a page was silent, the text says that it was.
What a record is made of
The help page for the strategy page lists the parts of a provider’s record: an ROI chart and an equity chart, a monthly ROI chart, a summary (net profit, pips, profit factor, percent profitable, maximum balance drawdown, starting and current balance, equity, deposits, withdrawals, margin used, active since), a performance section with the winning and losing trades, a volume breakdown, a trades tab, investor statistics, a list of symbols, the open positions and the history of closed deals. The six pages of this guide take one element each: the curve, the fall, the length, the leverage, the followers, and what no record shows.
What the public card prints
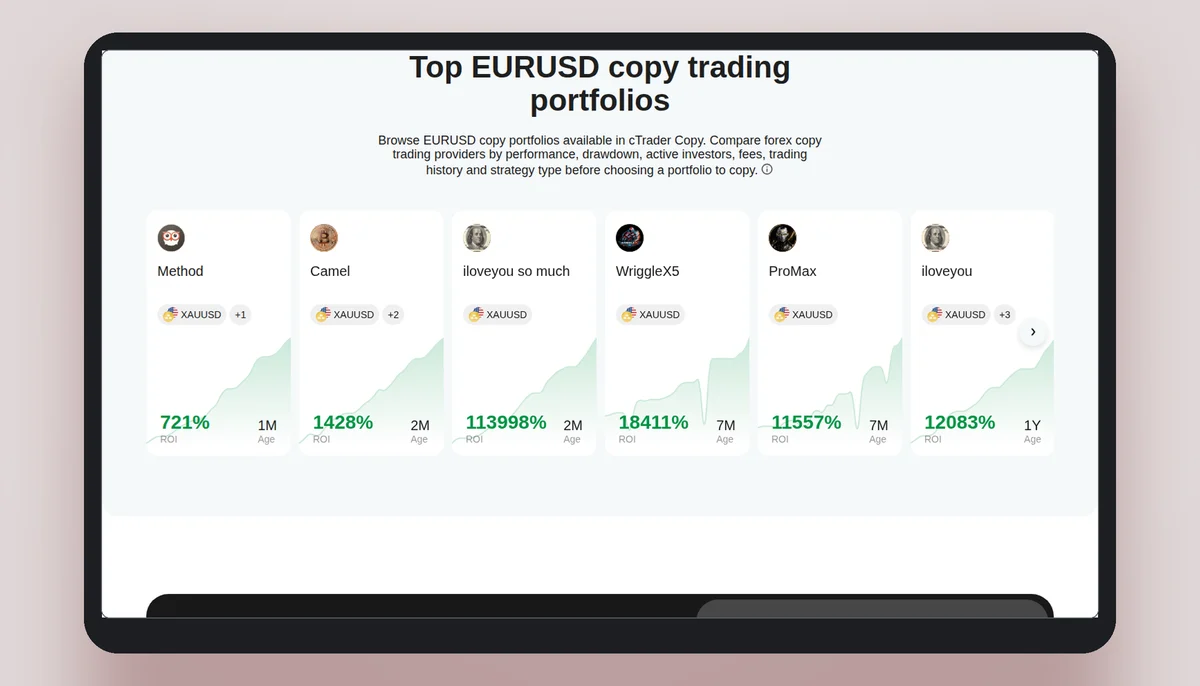
The symbol pages at ctrader.com/copy/symbols print a card for each strategy: a nickname, a strategy name, the symbols, a return with the label ROI, an age label such as 1M or 1Y, and a small curve. The data behind the page adds the minimum investment, the creation date and the 29 daily points of the curve. The data behind each of the three symbol pages that were read (gold, bitcoin and the euro) holds the same 20 cards. The table below lists all 20, in order of creation date, with the date of the reading on every row.
The 20 cards, in order of creation date, read on 6 November 2026
Order: creation date, oldest first. It is not an order of quality and no column was sorted. “Age” is the days from the creation date to 6 November 2026. “Curve end / largest fall” is the last of the 29 daily points of the card’s small curve (8 October 2026 to 5 November 2026) and the largest drop from an earlier point inside it, both in the chart’s own unit, which the card does not label. The last column before the date is the return exactly as printed; the card does not say over what period. A printed return is not an expectation. It is a number the platform printed beside a strategy on the day the page was read; it is not a result any follower obtained, and nothing on this site says that a reader will receive it, or anything near it.
| Created (age) | Provider · strategy | Symbols | Minimum | Curve end / largest fall | Printed ROI (%) | Read on |
|---|---|---|---|---|---|---|
| 6 Feb 2023 (1,369 days) | LogicFX · Empire Trades | EURUSD | USD 100 | 4.1 / 0 | 736 | 6 Nov 2026 |
| 2 Jun 2023 (1,253 days) | ctid4925965 · The Deep Secret | XAUUSD | USD 50,000 | −0.58 / −2.02 | 537 | 6 Nov 2026 |
| 12 Jun 2023 (1,243 days) | ToTheMoonRobot · PainGain cTrader | AUDCAD | USD 100 | 3.91 / −3.88 | 1,364 | 6 Nov 2026 |
| 24 Jun 2023 (1,231 days) | ctid4925965 · Diesel | XAUUSD | USD 5,000 | 0.94 / −2.03 | 447 | 6 Nov 2026 |
| 9 Dec 2023 (1,063 days) | husseinalmoders · CR7 | US 30, US 500, XAUUSD | USD 100 | −13.66 / −16.4 | 5,159 | 6 Nov 2026 |
| 25 Jan 2025 (650 days) | ctid4925965 · SMART TRADER OM | XAUUSD | USD 1,000 | 1.14 / −2.43 | 427 | 6 Nov 2026 |
| 17 Sep 2025 (415 days) | ctid4925965 · Rostova | XAUUSD | USD 1,000 | 1.12 / −2.41 | 55 | 6 Nov 2026 |
| 30 Oct 2025 (372 days) | femaletrader131341 · iloveyou | XAUUSD, US30, USTEC, DE40 | USD 500 | 32.05 / −0.1 | 12,083 | 6 Nov 2026 |
| 4 Mar 2026 (247 days) | NeuroPhi · BlackSignal | XAUUSD, US100 | USD 500 | 11.39 / 0 | 406 | 6 Nov 2026 |
| 16 Mar 2026 (235 days) | RacerX5 · WriggleX5 | XAUUSD | USD 400 | 42.89 / −36.79 | 18,411 | 6 Nov 2026 |
| 17 Mar 2026 (234 days) | M.fund · ProMax | XAUUSD | USD 200 | 37.41 / −22.15 | 11,613 | 6 Nov 2026 |
| 30 Mar 2026 (221 days) | Aliyainvestments · ONE 9 | GBPCAD, EURAUD, EURSGD and 7 more | USD 500 | −4.3 / −6.75 | 15 | 6 Nov 2026 |
| 10 Apr 2026 (210 days) | xauusdorbit · GOLD ORBIT | XAUUSD, USTEC, US30 | USD 100 | 20 / 0 | 1,138 | 6 Nov 2026 |
| 10 Apr 2026 (210 days) | xauusdmars · GOLD MARS | XAUUSD | USD 100 | 14.95 / −0.06 | 502 | 6 Nov 2026 |
| 30 Jun 2026 (129 days) | antoninsus21 · Smartegy Trading | US500 | USD 100 | −0.75 / −1.14 | −3 | 6 Nov 2026 |
| 10 Jul 2026 (119 days) | Aliyainvestments · ONE | GBPCAD, EURAUD, EURSGD and 7 more | USD 500 | −3.66 / −11.02 | −17 | 6 Nov 2026 |
| 19 Aug 2026 (79 days) | EUFund · Less risk it more bisquit | XAUUSD, US TECH 100 | USD 1,000 | 27.06 / 0 | 259 | 6 Nov 2026 |
| 22 Aug 2026 (76 days) | Ethereum · Camel | XAUUSD, BTCUSD, EURUSD | USD 400 | 112.71 / −3.11 | 1,428 | 6 Nov 2026 |
| 3 Sep 2026 (64 days) | femaIetrader131341 · iloveyou so much | XAUUSD | USD 300 | 78.71 / 0 | 113,998 | 6 Nov 2026 |
| 18 Sep 2026 (49 days) | Li5056 · Method | XAUUSD, BTCUSD | USD 400 | 245.28 / 0 | 721 | 6 Nov 2026 |
How to read the table
The first column gives the creation date and the age at 6 November 2026. The symbols are the ones the card lists; where a card lists more than four, the first three are shown and the count of the rest (the page on length of history gives the full set for the nickname that has two such cards). The minimum investment is what the strategy asks of a follower at the start. The curve column gives the last of the 29 points and the largest drop from an earlier point; the unit is the chart’s own, which the card does not name. The printed return is the number as the page prints it. The card does not state the period it covers, so the table sets it in a column of its own and no sentence on this site relies on it. The platform updates the printed return, so a later view of the page can show other numbers than this table, which was read earlier on the day; the picture beside this text, taken later, shows some of them.
Of the 20 rows, twelve end the window at their highest point, six show no fall inside it and five end below zero. Those are counts of a 29-day window; they say nothing about the days before it.
Two rows read aloud
The first and the last rows are used here only because of where they stand in the order of creation, not because of what they print. LogicFX · Empire Trades was created on 6 Feb 2023 and is 1,369 days old. It lists EURUSD and asks USD 100 at the start. Its 29-day curve starts with six identical zero points, ends at 4.1, which is its highest point, and shows no fall inside the window. The window is 2.1% of its life. The card leaves open how the other 1,340 days looked, how deep its deepest fall was and how large its positions were.
Li5056 · Method was created on 18 Sep 2026 and is 49 days old. It lists XAUUSD, BTCUSD and asks USD 400. Its curve ends at 245.28, again its highest point, and shows no fall. The window is 59.2% of its life, so the curve is more than half of the record there is. That makes it a short record, not a clean one: what a provider does in a fall has not yet had a chance to show.
A printed return is not an expectation
A printed return is not an expectation. It is a number the platform printed beside a strategy on the day the page was read; it is not a result any follower obtained, and nothing on this site says that a reader will receive it, or anything near it. The symbol pages themselves carry the sentence “Past performance does not guarantee future results.”.
The cards are shown in order of creation date so that no order can be read as a judgement. None is called good or poor, and none is recommended.
The platform’s own words for the parts of a record
Quoted from the help page on the strategy list and strategy page, read on 6 November 2026. The right column is a two-or-three word gloss, not a finding.
| Term | The help page’s wording | In short |
|---|---|---|
| Equity chart | “plots time on the X-axis and the cash value on the Y-axis” | The line of the account’s value |
| ROI (%) chart | “the return on investment the strategy has generated during the chosen period, in relation to the account balance the strategy had at the beginning of the period” | A percentage of a starting balance |
| Max balance drawdown | “the maximum percentage of balance drawdown” | The deepest fall of the balance |
| Percent profitable | “the number of winning trades divided by the total number of trades” | Winners counted, not weighed |
| Profit factor | “the ratio of the total net profit divided by the total net loss of the strategy” | Profit set against loss |
| Active since | For a strategy: “the date when the strategy was provided for copying”. For a provider: “the date when the provider started providing their first strategy” | Two different start dates |
| Average profit | “the average profit of all the provider’s strategies” | A provider-level average |
| Rank | “a proprietary method used to prioritise strategies in a comprehensive way, taking into consideration many parameters” | The platform’s own ordering; this site has none |
Rank: the platform’s method, not this site’s
The help page lists the inputs of Rank: ROI (with recent ROI weighted over historical ROI), Equity-based ROI, Trade duration, Trade activity, Number of profitable months, Risk, Equity drawdown, Risk reward, Invested funds, Number of live investors, Own funds and Fees. That is twelve. The page gives no weights. The platform orders its list by that method, or by ROI, investors or investor funds, as the reader chooses. This site orders by creation date and does not rank. The page on followers sets the list out in full.
What sits behind the login
The strategy pages, where the help page places maximum balance drawdown, percent profitable, the count and size of trades, leverage, open positions and the history of deals, are inside the application. This site did not log in and did not open one. So the cards here have no drawdown statistic, no win rate and no trade list. A reader who needs them must read them on the platform. The page on what a record cannot show has the table of what is where.
The names on the cards
The 20 cards carry 16 different nicknames. The nickname is chosen by the provider and is printed as chosen; it says nothing about who the provider is or what the strategy trades. ctid4925965 appears on four cards and Aliyainvestments on two; the page on length of history sets them out. Two nicknames, femaletrader131341 and femaIetrader131341, differ in a single character. The cards do not say whether any of these are related, and this site draws no conclusion.
How old the cards are
By year of creation the cards are 2023 (5), 2025 (3), 2026 (12). The oldest is 1,369 days old at 6 November 2026 and the youngest 49. The small curve covers 29 days, which is 2.1% of the oldest card’s life and 59.2% of the youngest’s. A reader who looks at the curve alone sees the same amount of time on a card of four years and a card of seven weeks.
Questions to put to any record
Which period does the line cover, and is it equity or balance? How deep was the largest fall, and how long did the account stay below its old high? On what date did this strategy start, and on what date did the provider’s first strategy start? How large were the positions compared with the account, and what are the open positions now? Do the statistics count closed trades only? Who the followers are, and how many, does not answer any of these. And what is not in the record: the days before it, the strategies that stopped, the price at which a follower would have entered.
What this site did not do
It did not log in anywhere, open an account, copy a strategy or measure a fill. It did not read price data for the dates of the cards. It did not read the help page on ROI calculation, so it does not say how the printed return is computed. It publishes no ranking, no list of strategies to follow and no return a reader could expect. A site that did would be selling something, and the reader would hold the risk.
When the readings were taken
The symbol pages and the help pages were saved on 6 November 2026, one request at a time with a pause between them. The curves run from 8 October 2026 to 5 November 2026. A later reading may differ: cards are added, cards change order and a help page can be revised. Each figure carries its date so that it can be checked against the page, and a figure without the date it was read is not published here.
How a figure on this site is checked
The cards were counted twice. The first count is the shared feed. The second is made from the saved pages by another route, with a text pattern in place of a parser: it recounts the nickname, strategy name, printed return, minimum investment, creation date, age and every curve’s last point and largest fall for all 20 cards, and any difference is reported as an error. That checks the copying of the numbers. It does not check that the platform’s pages are right.
Six elements of a record, read one by one
- The equity curveWhat the equity chart and the ROI chart plot, and what the small curve on a card is and is not.
- Drawdown in wordsMaximum balance drawdown, equity drawdown, and the largest fall and time under an old high on each card.
- Length of historyTwo dates called Active since, and the 29-day curve against a card of 1,369 days and one of 49.
- Leverage behind the curveWhere the platform puts leverage and margin, and what percent profitable and profit factor count and leave out.
- Followers are not qualityThe counts the help page names, and the twelve inputs of its own Rank. This site ranks nothing.
- What a record cannot showStrategies that stopped, the follower’s own entry, fees, the provider’s next decision, and the login.
The broker this site links to
This site links to FxPro, which cTrader’s list marks as a copy-enabled broker. A copied trade is a leveraged contract on a price, not ownership of anything. Read the terms before you decide anything.