
The leverage behind the curve
A curve says how far an account moved. It does not say how large the positions were that moved it. This page reads what the platform’s help page says about leverage, margin and trade size, shows where each sits, defines the practices that hold losing positions open, and sets out what six common statistics count and leave out. A copied trade is a leveraged contract on a price; the follower carries the loss.
Where leverage and size show up on the platform, read on 6 November 2026
Source: help.ctrader.com/ctrader-copy/account-and-strategy-page. The cards on the symbol pages print none of the middle-column items; the right column says whether each is on the card. This site did not open a strategy page.
| Item | What the help page says | On the public card? |
|---|---|---|
| Leverage of the strategy account | “the currency, leverage and copying conditions” are displayed in the Details tab | No |
| Margin used | “the maximum margin between the sum of all long or all short positions margins used” (Summary) | No |
| Average trading size | The Volume breakdown shows “the symbols that were traded, their respective volumes, average trading size” | No |
| Symbols traded | Symbols tab, “based on the closed positions” | Yes, as a list of names |
| Maximum leverage of a broker | The broker list on ctrader.com/copy/brokers prints one maximum per broker | Not on the card |
Size relative to equity
Leverage lets a position be larger than the money in the account. What matters for a record is the size of positions against the account’s equity, because the same price move changes the equity by more when positions are larger. Twice the position size gives twice the gain or twice the loss for the same move. This is a definition, not a finding about any provider.
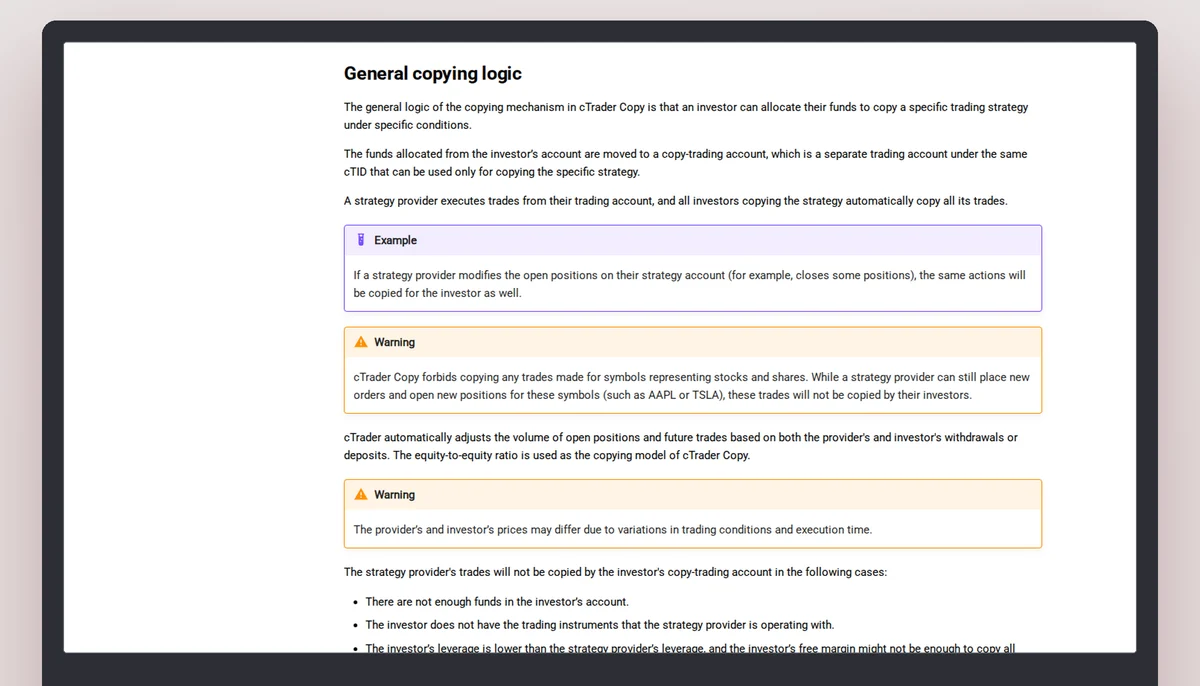
The help page’s copying model passes that size on. The volume copied is “Investor’s Equity / Strategy Provider’s Equity * Strategy Provider’s Volume”, so the lots per unit of equity are the same on both sides, before the adjustments the page lists. A provider who sizes large against equity gives a follower the same relative size. The help page’s own example is a provider with USD 4,000 who opens 4 lots, copied as 1 lot by an investor with USD 1,000.
Why it shows in the falls and not in the end figure
Two accounts can end a period at the same height after very different journeys. If both took the same trades, the account with the larger positions moved further on every price move, so its falls on the way were deeper, and the end figure does not show that. The numbers that do are the largest fall, the time below an old high and the largest losing trade, all of which sit on the strategy page. The public card carries one small curve and a symbol list.
Holding a loser open: three names for it
Averaging down means adding to a position that is losing. A grid places orders at set price intervals, so that positions are added as the price moves one way. A martingale increases the size after a loss. In each case the closed trades can show a high share of wins while the losing positions stay open, because a loss that is open is not yet a closed trade. The help page counts the winning share of closed positions: its “Total trades” is “the total number of closed positions”, and its open positions sit in a separate Positions tab. The gap between balance and equity is where open results show, since equity is balance minus unrealised loss plus unrealised profit. A reader who is given a balance chart and a win rate has not been shown that gap.
An illustration in arithmetic
Take ten closed trades: nine win 1 each and one loses 12. Percent profitable is 90 per cent. Net result is 9 minus 12, which is minus 3. Profit factor, net profit over net loss as the help page defines it, is 9 divided by 12, which is 0.75. The numbers are invented to show the arithmetic and are not from any provider. They show why a high percent profitable and a loss can sit in the same record.
Six statistics: what each counts and what it leaves out
The middle column is the help page’s definition. The right column is what the definition does not contain, as a question for a reader to put.
| Statistic | Definition on the help page | Not in the number |
|---|---|---|
| Percent profitable | “the number of winning trades divided by the total number of trades” | How large the wins and the losses were; positions still open |
| Profit factor | “the ratio of the total net profit divided by the total net loss of the strategy” | How deep the account went on the way; whether the result rests on a few trades |
| Total trades | “the total number of closed positions throughout the strategy” | Open positions, which are listed on a separate tab |
| Average trade | “the average profit for all trades throughout the strategy” | The spread around the average |
| Largest losing trade | “the closing deal with the largest negative result throughout the strategy” | The size of the account at the time; losses not yet closed |
| Max balance drawdown | “the maximum percentage of balance drawdown” | The movement of equity while trades were open |
What the symbol list does and does not say
Of the 20 cards, eleven list a single symbol and three list four or more, up to 10 on Aliyainvestments · ONE 9. The list says what a strategy has traded. It does not give the lot size, the leverage or the number of positions open together. A short list is not a low risk and a long list is not a high one; the card has no figure that would settle it.
One further point on the follower’s side. The help page says that if the investor’s leverage is lower than the provider’s, the investor’s free margin may not suffice to copy all the trades, and the investor “may reach the stop out earlier than the strategy provider”.
In brief
Read next
Questions about reading a record
Does the card show how much leverage a provider used?
No. The help page puts leverage in the Details tab and margin used in the Summary, both on the strategy page.
Why can a high percent profitable sit with a loss?
Because it counts closed trades, not their size. The arithmetic example on this page has nine winners of 1 and one loser of 12.
Is a martingale or a grid a failure?
This site makes no claim about any strategy. It defines the terms and says that open losing positions do not count in closed-trade statistics.
Where would a follower see open positions?
In the Positions tab and the History tab of the strategy page, per the help page.
The broker this site links to
This site links to FxPro, which cTrader’s list marks as a copy-enabled broker. A copied trade is a leveraged contract on a price, not ownership of anything. Read the terms before you decide anything.