
Drawdown, in words
A drawdown is a fall from a high point to a later low point. A follower lives through the falls of a record, not through its end figure. This page separates the three things the word can mean, computes a fall and a time below an earlier high for 20 named cards over a 29-day window read on 6 November 2026, and says where the platform keeps the figure that covers a provider’s whole history.
Three things the word can mean
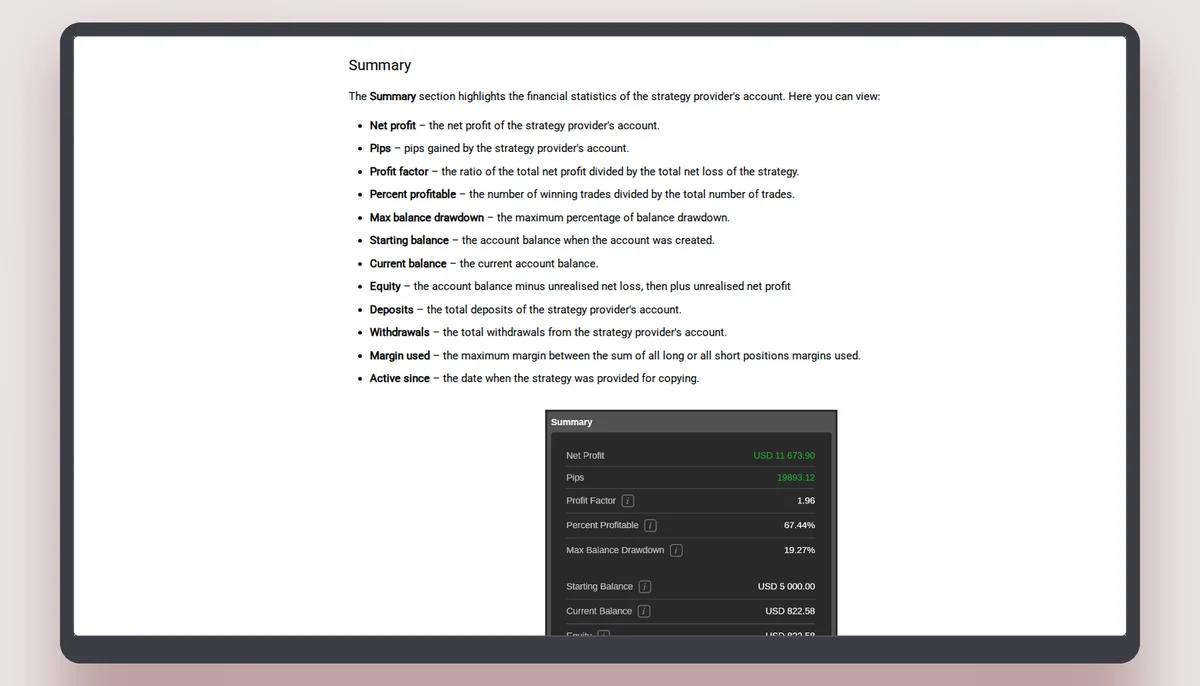
The help page for the strategy page names a statistic “Max balance drawdown” and defines it as “the maximum percentage of balance drawdown”; on the Trades tab the wording is “the maximum percentage of the balance drawdown recorded for the strategy”. It also lists “Equity drawdown” among the inputs of its Rank. Balance and equity are not the same thing: balance changes when a trade closes, equity also moves while a trade is open (the help page defines equity as balance minus unrealised net loss plus unrealised net profit). The help page does not say whether the two drawdowns are equal for a given strategy, and this site does not say so either. The third meaning is the one used in the table below, which is this site’s own: the largest drop from an earlier point inside a 29-point curve, in the unit of the card’s chart. It is a computation on a short window, not the platform’s statistic.
A fall in plain arithmetic
The size of a fall depends on what it is measured against. A fall from 100 to 80 is a fall of 20 per cent. To get from 80 back to 100 the account must gain 25 per cent, because the gain is measured against 80. A fall from 100 to 50 is a fall of 50 per cent and needs a gain of 100 per cent to recover. This is arithmetic, not a record. It is the reason the depth of a fall matters more than its frequency, and the reason the time spent below an old high is a number a follower lives through.
Depth and time below an earlier high, read on 6 November 2026
For each card: the largest fall; the number of the 29 daily points that sat below a high reached earlier in the same window; and the distance between the window’s highest point and its last point. A card can have no fall and no point below an earlier high only if the line never went down from one day to a later one.
| Card | Largest fall | Points below an earlier high | Highest minus last |
|---|---|---|---|
| LogicFX · Empire Trades | 0 | 0 of 29 | 0 |
| ctid4925965 · The Deep Secret | −2.02 | 15 of 29 | 0.63 |
| ToTheMoonRobot · PainGain cTrader | −3.88 | 10 of 29 | 0 |
| ctid4925965 · Diesel | −2.03 | 11 of 29 | 0.14 |
| husseinalmoders · CR7 | −16.4 | 25 of 29 | 16.4 |
| ctid4925965 · SMART TRADER OM | −2.43 | 11 of 29 | 0.18 |
| ctid4925965 · Rostova | −2.41 | 11 of 29 | 0.18 |
| femaletrader131341 · iloveyou | −0.1 | 3 of 29 | 0 |
| NeuroPhi · BlackSignal | 0 | 0 of 29 | 0 |
| RacerX5 · WriggleX5 | −36.79 | 7 of 29 | 0 |
| M.fund · ProMax | −22.15 | 10 of 29 | 0 |
| Aliyainvestments · ONE 9 | −6.75 | 25 of 29 | 4.31 |
| xauusdorbit · GOLD ORBIT | 0 | 0 of 29 | 0 |
| xauusdmars · GOLD MARS | −0.06 | 1 of 29 | 0 |
| antoninsus21 · Smartegy Trading | −1.14 | 22 of 29 | 1.14 |
| Aliyainvestments · ONE | −11.02 | 25 of 29 | 3.68 |
| EUFund · Less risk it more bisquit | 0 | 0 of 29 | 0 |
| Ethereum · Camel | −3.11 | 3 of 29 | 0 |
| femaIetrader131341 · iloveyou so much | 0 | 0 of 29 | 0 |
| Li5056 · Method | 0 | 0 of 29 | 0 |
How to read the table
The second column is the largest drop from an earlier point inside the window. The third counts the daily points that sat below a high reached earlier in the same window: a card that sits at its high every day shows 0, a card that fell on day four and never recovered shows a large part of the window. The fourth is the window’s highest point minus its last point, which is zero for the twelve cards that end at their high. Four cards show a largest fall deeper than 10 chart units (CR7, WriggleX5, ProMax, ONE). The units are the card’s own and unlabelled, so no fall in the table is a percentage of anyone’s money.
A window with no fall
Six of the 20 cards show no fall at all in the window (Empire Trades, BlackSignal, GOLD ORBIT, Less risk it more bisquit, iloveyou so much, Method). That is a fact about 29 days. A provider’s behaviour in a fall can only be read from a record that contains one; a record that has not yet contained one has not yet shown it. The figure that covers the whole history is the maximum balance drawdown on the strategy page, and the help page places that page in the application. This site did not read it.
Whose account the fall is on
In the help page’s copying model, the volume of a copied trade is the investor’s equity divided by the provider’s equity, times the provider’s volume. So a trade is the same fraction of each account, which is why a fall is better compared in percent of equity than in money. In money it is not the same: a fall of 20 per cent is USD 200 on an allocation of USD 1,000 and USD 20,000 on USD 100,000. The help page adds two reasons the follower’s number can differ from the provider’s: prices “may differ due to variations in trading conditions and execution time”, and a trade is not copied at all when the investor’s account has too little funds, lacks the instrument, or has lower leverage and too little free margin.
When the provider moves money
The help page warns that when a strategy provider deposits or withdraws funds on the strategy account while positions are open, this “can cause losses for investors’ copy-trading accounts”, because every position is recalculated on the new equity ratio. A deposit or a withdrawal is not a trade and does not appear as a fall in a chart of returns. The strategy page lists “Deposits” and “Withdrawals” among its summary figures, so the information exists; it is inside the application.
In brief
Read next
Questions about reading a record
What is a drawdown?
A fall from a high point to a later low point. It can be stated as an amount or as a percentage of the high point.
Is the largest fall in this site’s table the platform’s maximum balance drawdown?
No. It is computed here from 29 chart points, in the card’s unlabelled unit. The platform’s statistic is on the strategy page and was not read.
Does a card with no fall have no risk?
No. It has shown no fall in 29 days. The window says nothing about days outside it.
Why does time below the old high matter?
While the account is below its old high, a follower who joined at the high has not recovered. The table counts how many of the window’s points sat below an earlier high.
The broker this site links to
This site links to FxPro, which cTrader’s list marks as a copy-enabled broker. A copied trade is a leveraged contract on a price, not ownership of anything. Read the terms before you decide anything.